Investigation on Dream's cheating
This is a coursework project for ESTR2018, Probability for Engineers. I collaborated with a classmate in this project. You can find the github repo of the project here and the report of the project here.
Background
In October 2020, Dream, a renowned famous Minecraft YouTubers, was accused of cheating during his numerous speedrun attempts because of “being too lucky” in two events: Piglin bartering and collecting blaze rods. Later, the Minecraft Speedrunning Team (MST) published a detailed 29-pages report concluding he cheated.
This project showed how MST found Dream guilty of cheating with probability, and suggested how Dream could have remained "unsicipicious" with the help of Central Limit Theorem.
Piglin bartering
In Minecraft, players can trade with piglins. Each trade have a 20/423 (approximately 0.047) chance of being an ender pearl trade, which is desired by speedrunners. Dream attempted 262 trades, and got 42 ender pearl trades. His odd is approximately 0.16, which is significantly larger than the defualt odd. So that's pretty unlikely to occur, but how unlikely?
Turns out we can use binomial distribution to model the the number of ender pearl trades. The probability of getting 42 or more ender pearl trades out of 262 attempts can be calculated by summing the probability mass function of the binomial from 42 to 262, which evaluates to approximately 5.6 x 10^(-12), an extremely small number.
Blaze rod
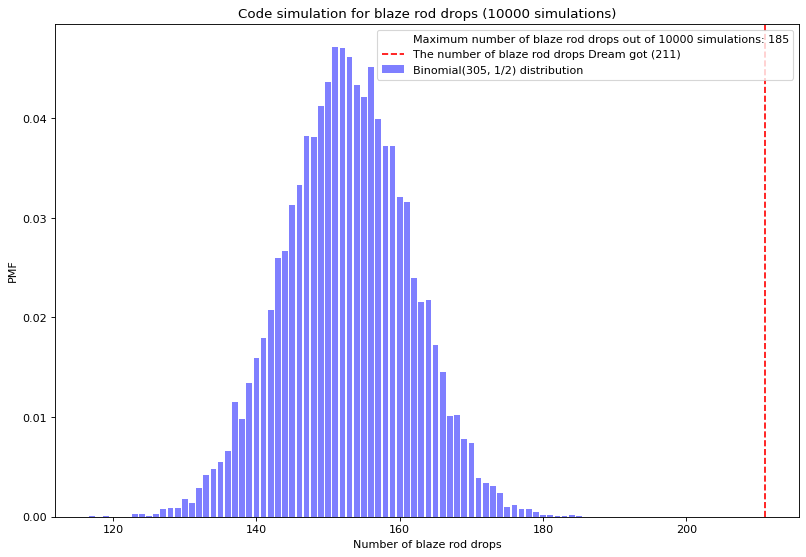
Similar to piglin batering, Minecraft speedrunners kill blazes to get blaze rods, and a blaze has a 50% chance of dropping blaze rod(s) when killed. For Dream, 211 out of 305 blazes killed dropped blaze rod(s). Repeat the calculations and one can find Dream's odd to be 8.8 x 10^(-12), which is also extremely small.
Code simulations
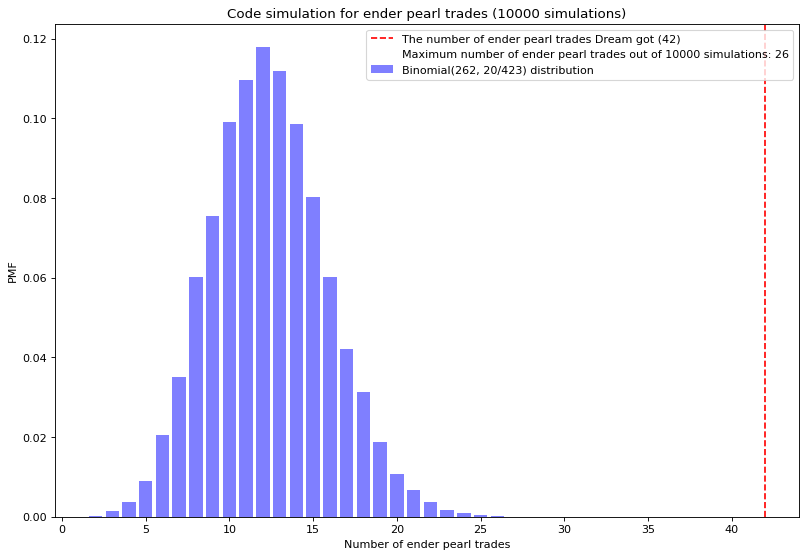
We have coded several simulations in jupyter notebook. For example, we have simulated 10,000 times, each time having 262 trades, and found that the distribution of the number of ender pear trades is very similar to a binomail distribution, and Dream's odd is extremely low.
We first import the libraries needed (matplotlib for ploting the graph, random and collections for calculations), then set the parameters for the simulations.
import random
import matplotlib.pyplot as plt
from collections import Counter

# set the parameters
number_of_simulation = 10000
data = [] # storing no. of trades for each trial, elements could repeat
n = 262
p = 20/423
dreams_result = 42 # the number of successful ender pearl trades Dream got
Then we simulate repeatedly, store the result, clean up the data and find the maximum number of ender pearl trades out of 10,000 simulations (for comparasion).
# repeat simulation
for i in range(number_of_simulation):
    success_num = 0
    for j in range(n):
        if random.random() < p:
            success_num += 1
    data.append(success_num)

# clean up the data
dict = Counter(data)
x_values = list(dict.keys())
y_values = list(y/number_of_simulation for y in dict.values()) # turn frequency into relative frequency

# find max
max_x = max(x_values)
Finally, we plot the graph with the data simulated using matplotlib.
# plot the graph
fig = plt.figure(figsize=(12, 8), dpi=80)

plt.bar(x_values, y_values, color='blue', alpha=0.5, label='Binomial(262, 20/423) distribution')
plt.title(f"Code simulation for ender pearl trades ({number_of_simulation} simulations)")
plt.axvline(dreams_result, color='r', linestyle='--', ymax = 1, label = "The number of ender pearl trades Dream got (42)")
plt.plot([], [], ' ', label=f"Maximum number of ender pearl trades out of {number_of_simulation} simulations: {max_x}")

plt.legend()

plt.xlabel("Number of ender pearl trades")
plt.ylabel("PMF")
#plt.text(50, 0.02, "Red dotted line: The number of ender pearl trades Dream got (42)", fontsize=8, color='black')
#plt.text(50, 0.01, f"Maximum number of ender pearl trades out of {number_of_simulation} simulations: {max_x}", fontsize=8, color='black')
plt.show()
Similarly, the code simulations for blaze rod supports the claim:
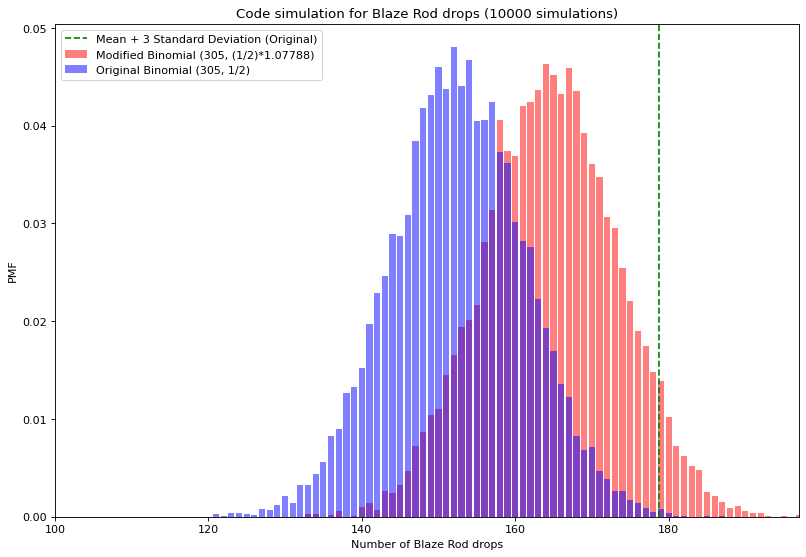
How Dream could remain "unsuspicious"
This section will discuss how Dream could main "unsuspicious" by lowering his "luck".
We suppose his probability of getting ender pearl trades/ blaze rod drop(s) is m • p, where m is a constant > 1 and p is the original probability.
We defined "unsuspicious" as the number of ender pearl trades/ blaze rod drop(s) is less than or equal to a lenient threshold of mean + 3 s.d. We also set the goal of being "unsuspicious" 95% of the time.
It turns out Central Limit Theorem can be applied here find the values of m. For the detail calculations, please check the report.
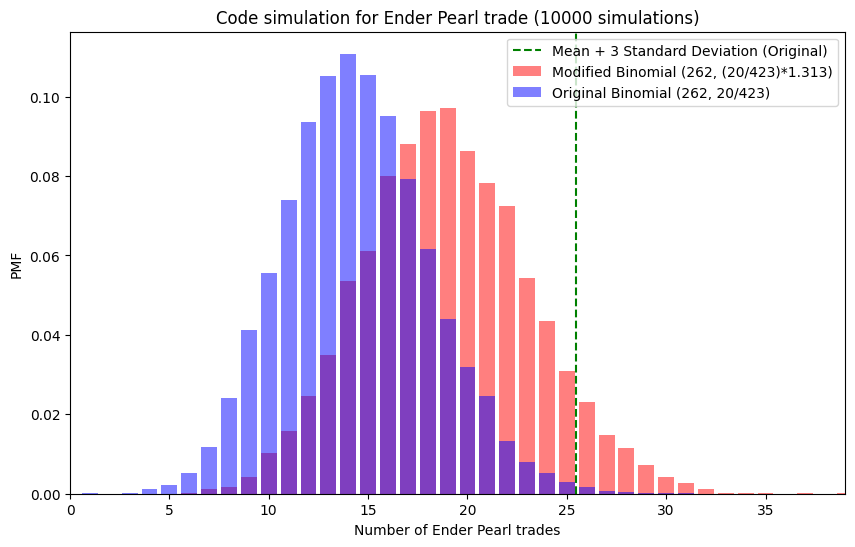
For blaze rod, we found that Dream could only get 7.79% more blaze rod drop(s) at max while being "unsuspicious"; where as for ender pearl trade, Dream could get 31.3% more.
Code simulations are also implemented and the results are as follow: